
Displacement error
inertia=beam_b*beam_h**3/12
uy_ref=tip_force*beam_l**3/(3*young*inertia)
uy_error=ABS(uy_tip_avg-uy_ref)/ABS(uy_ref)
The comparison retains the sign in the original values and uses magnitudes only
in the denominator of the error. Acceptance requires uy_error<0.05.
Which stress should we compare?
Beam theory predicts longitudinal normal stress. Therefore, compare it with
S,X, not with von Mises stress:
sigma_x = M(x)·y/I
S,EQV combines components using an energy criterion and is useful for other
decisions, but it does not represent the same magnitude as the previous equation.
Do not use the fixed support to characterize the beam
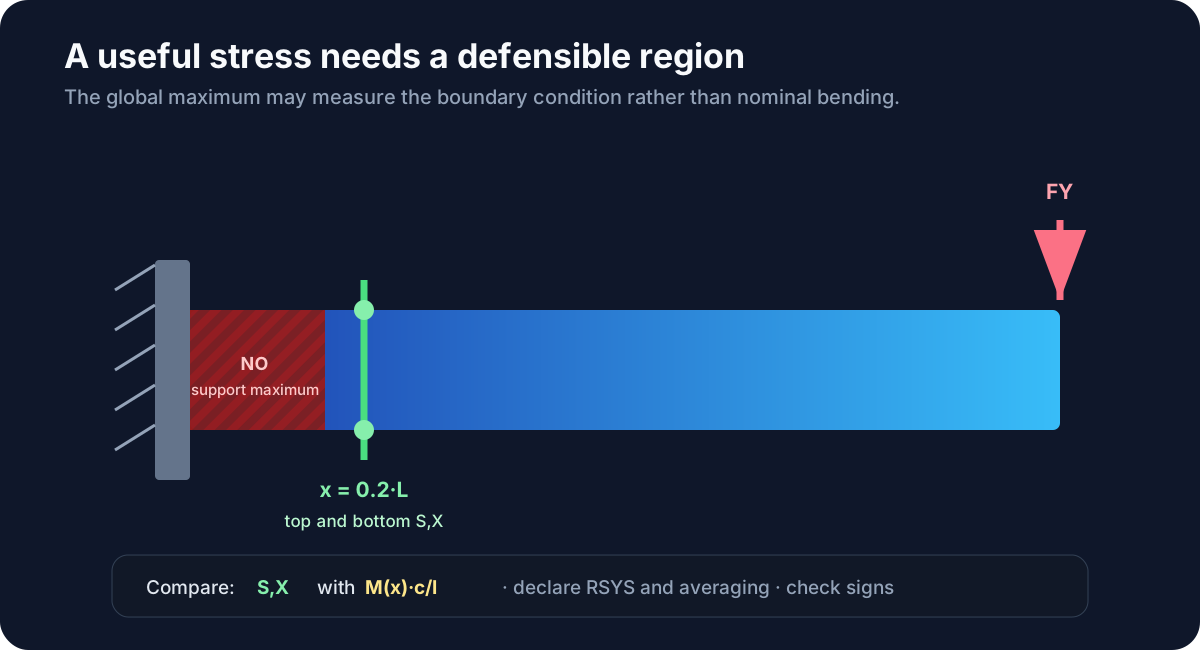
x=0.2·L.
At the fixed support, zero displacement is imposed on an entire face. The transition from that idealization to the deformable field creates mesh-sensitive stress concentrations. Using the maximum stress as the sole validation metric mixes nominal behavior with a local disturbance.
Stress reference in the interior section
x_section=0.2*beam_l
moment_section=ABS(tip_force)*(beam_l-x_section)
sigma_ref=moment_section*(beam_h/2)/inertia
For the base case:
M(0.2L) = 1000·(1−0.2) = 800 N·m
sigma_ref = 9.6 MPa
The section is two element lengths from the fixed support and sufficiently far from the load application.
Extract the upper and lower fibers
NSEL,S,LOC,X,x_section
NSEL,R,LOC,Y,beam_h
CM,stress_top_nodes,NODE

*GET,sx_node,NODE,node_id,S,X
The base mesh contains two nodes across the width at the top fiber and two at the
bottom fiber. We average each pair separately. For a force in the −Y direction,
we expect:
sx_top_avg > 0     ! tension
sx_bottom_avg < 0  ! compression
Magnitude and antisymmetry
sigma_fea=(ABS(sx_top_avg)+ABS(sx_bottom_avg))/2
stress_error=ABS(sigma_fea-sigma_ref)/sigma_ref
stress_symmetry=ABS(ABS(sx_top_avg)-ABS(sx_bottom_avg))/sigma_ref
The first metric checks the nominal magnitude. The second verifies that the extreme fibers
develop opposite stresses of similar magnitude, as predicted by pure bending.
Their respective limits are 10 % and 5 %.
PLNSOL vs. PLESOL
PLNSOL,S,X
PLESOL,S,XPLNSOLrepresents nodal values averaged across compatible elements.PLESOLpreserves the values of each element and leaves the breaks visible.
A smoother contour is not automatically more precise. Comparing both views helps detect how much the averaging is hiding.
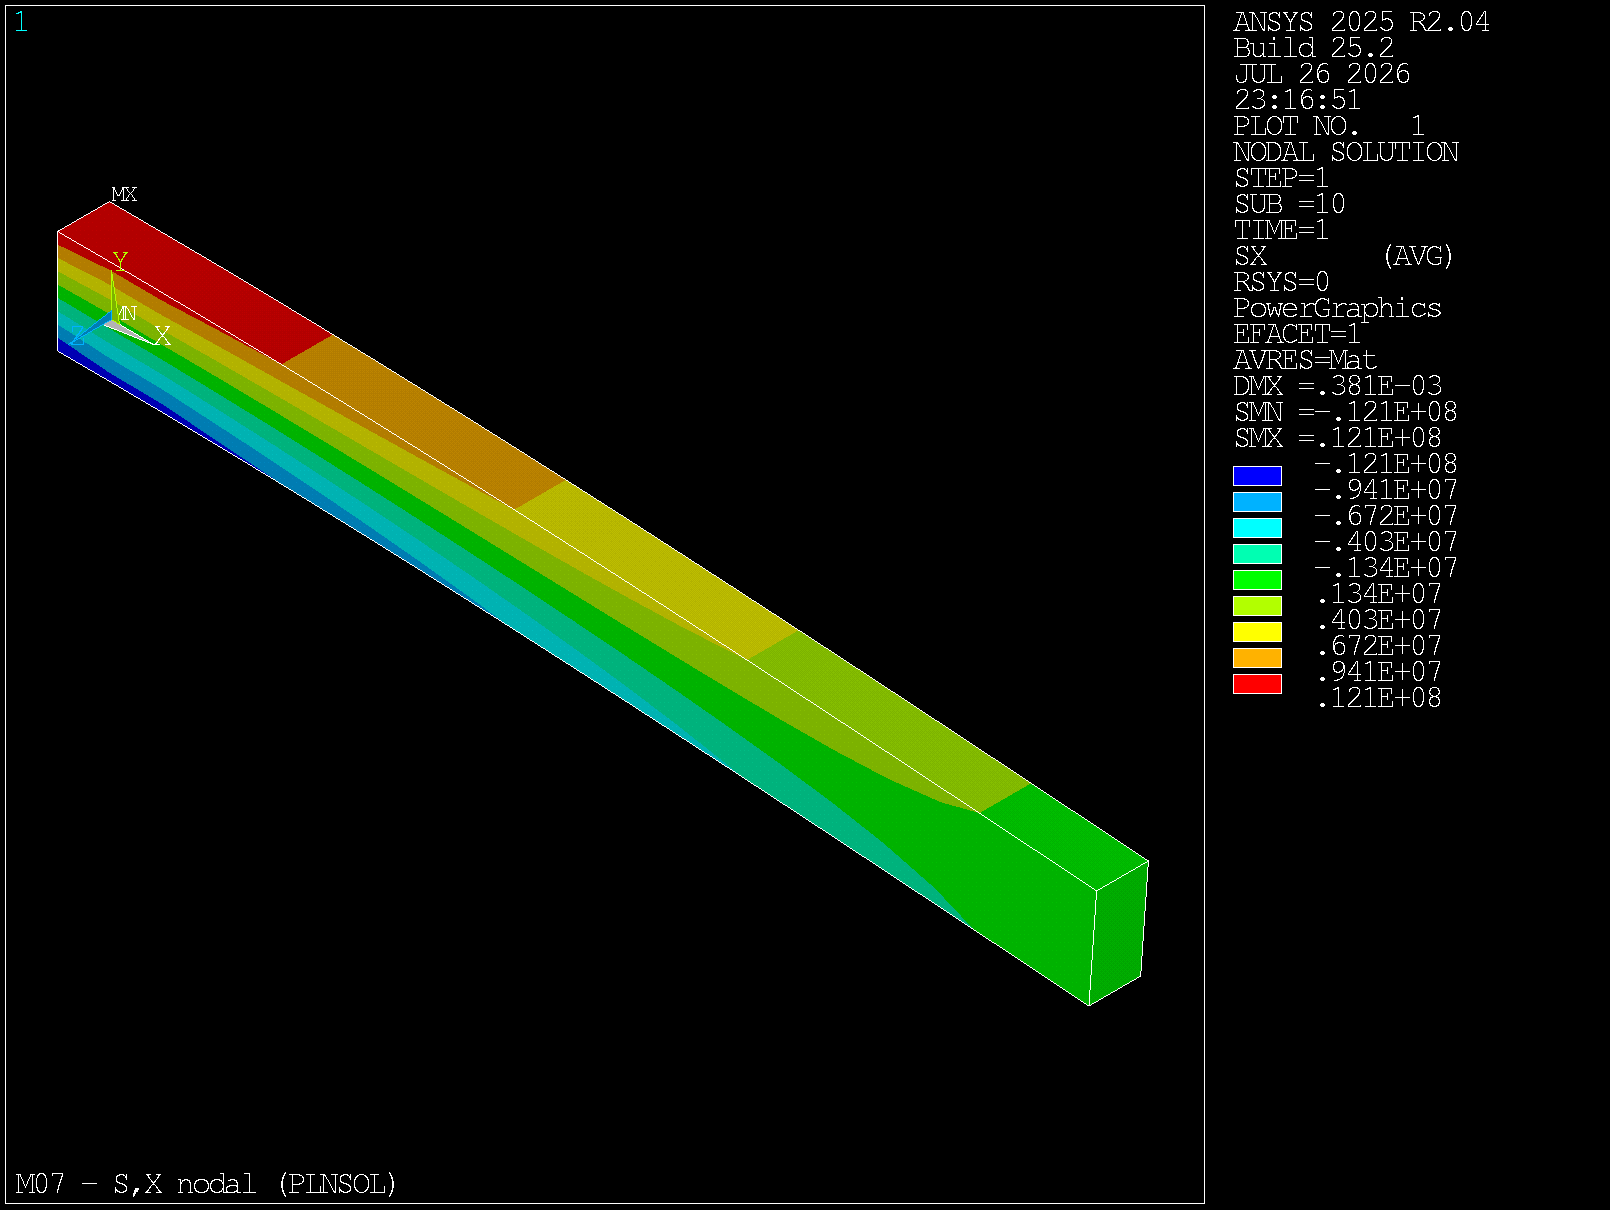
S,X stress (PLNSOL,S,X) in the interior section.
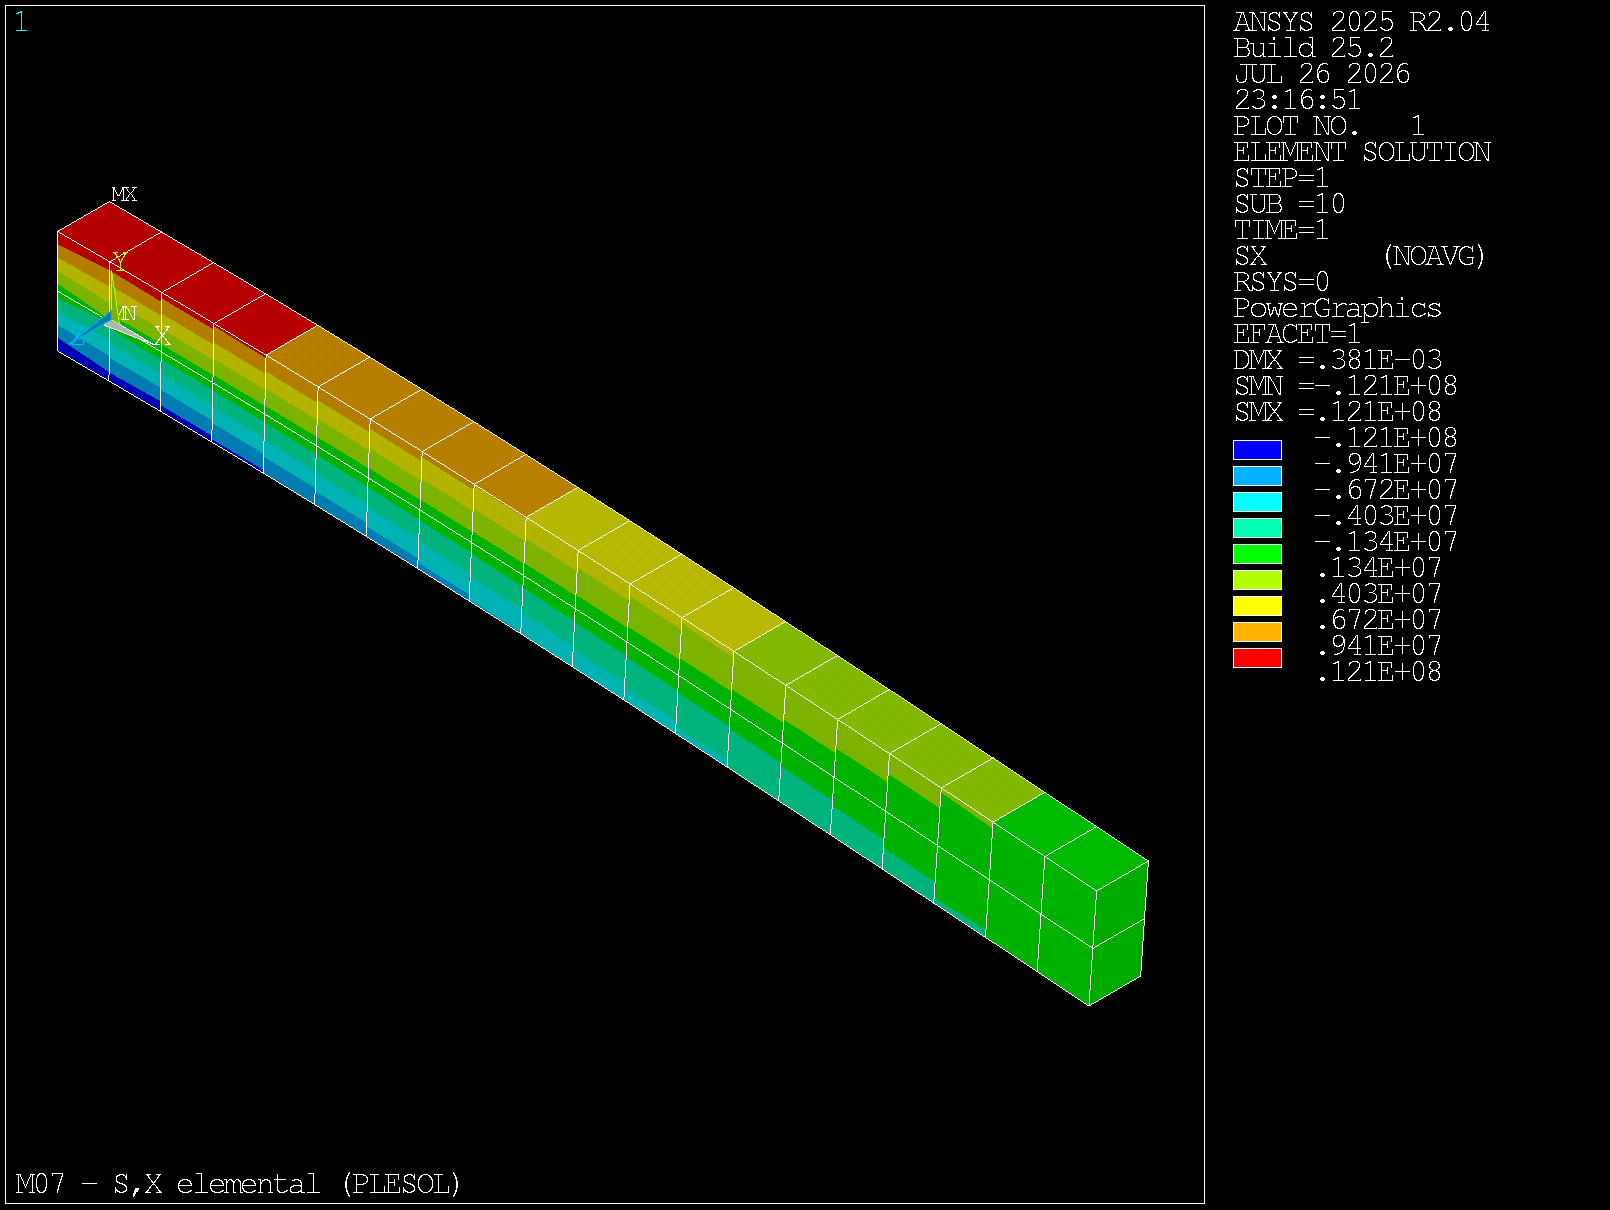
S,X stress (PLESOL,S,X). The key contrast with PLNSOL is that jumps remain visible at interfaces.