
Optional expansion — POST1 vs. POST26
This extension is not part of the M07 approval contract. It serves to distinguish two different questions:
/POST1- Represents a spatial field in a specific set: deformed shapes, contours, and point listings.
/POST26- Tracks a quantity across multiple sets: load–response curves or time histories.
The script 07_graphics_post26.mac solves the same case with a static ramp
(KBC,0), NSUBST,10 and OUTRES,ALL,ALL. In this context
TIME acts as a normalized load factor, not as physical
time. M14 will revisit /POST26 with an actual time history.
Load–response curve with POST26
/POST26
NUMVAR,10
NSOL,2,corner_node,U,Y
XVAR,1
/AXLAB,X,Load factor (TIME)
/AXLAB,Y,UY at corner node (m)
/SHOW,PNG
PLVAR,2
/SHOW,CLOSE
PRVAR,1,2
NSOL defines the variable, PLVAR draws the curve, and PRVAR
lists the points. To ensure that the graph is not the only evidence, the script also generates
m07_load_response.csv walking through the sets in POST1:
substep,load_factor,uy_corner_m,uy_ratio_to_final
Prediction: at 50 % load, UY should be approximately
half of the final value in a linear analysis. The expansion contract requires an error of
intermediate linearity lower than 2 %.
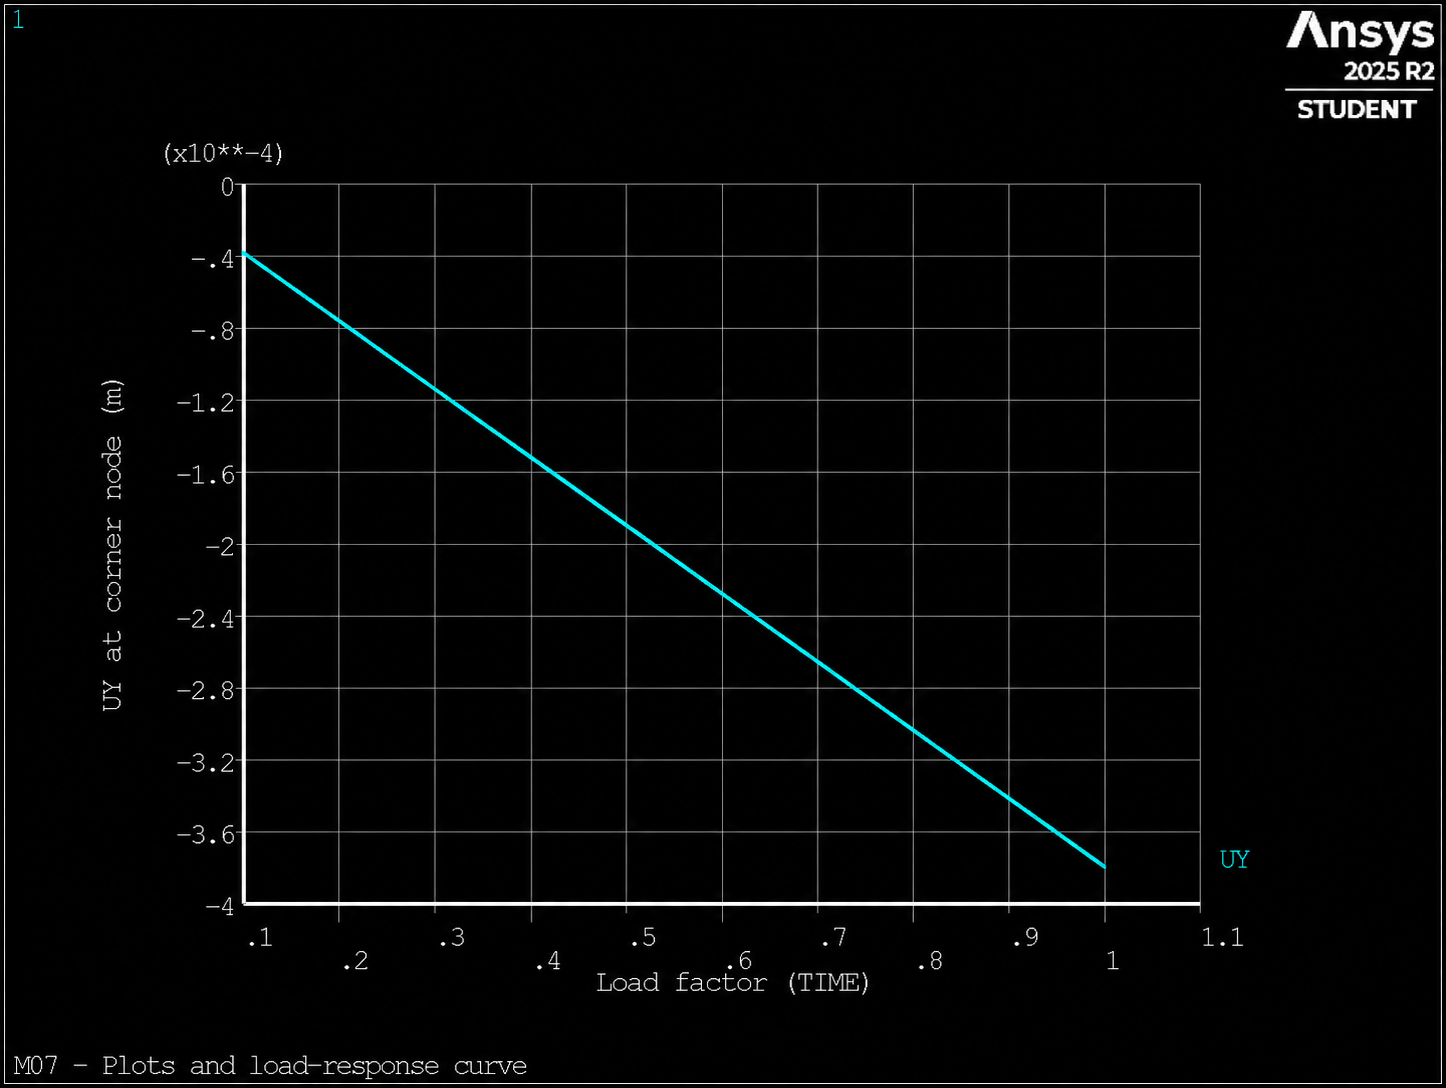
POST26, PLVAR,2). Intermediate linearity verified in m07_load_response.csv.
Extension challenge — Constant slope
Run 07_graphics_challenge.mac with final loads of
−500 N and −1000 N. Check that the slope
UY/F remains constant within the 2 %. The file
m07_graphics_slope_audit.csv documents both cases.