
Reproducible graphics with POST1
On-screen contours are useful for inspection, but a manual screenshot is not reproducible
evidence. Before plotting, activate the correct set with SET,LAST and declare
RSYS,0. Then redirect the graphical output with /SHOW,PNG
(not /SHOW,nombre,PNG, which writes invalid ANSYS raster as PNG):
/GFILE,1200
/DEVICE,VECTOR,1
/GRAPHICS,POWER
/SHOW,PNG
/TITLE,M07 - UY nodal (PLNSOL)
/AXLAB,X,X (m)
/AXLAB,Y,Y (m)
PLNSOL,U,Y
/SHOW,CLOSE
/GFILE sets the resolution; /TITLE and /AXLAB document
what the plot represents; /SHOW,CLOSE closes the graphics device. MAPDL writes
Jobname000.png, Jobname001.png, etc.; rename them if you need
descriptive names. Repeat the workflow for
PLDISP, PLNSOL,S,X and PLESOL,S,X.
Interpret the scale carefully: the deformation factor of PLDISP exaggerates the
shape; the contour legend can hide jumps between nodes and elements; units must
match /UNITS,SI. A well-labeled PNG helps communicate the result, but it does not
replace the validation CSV.
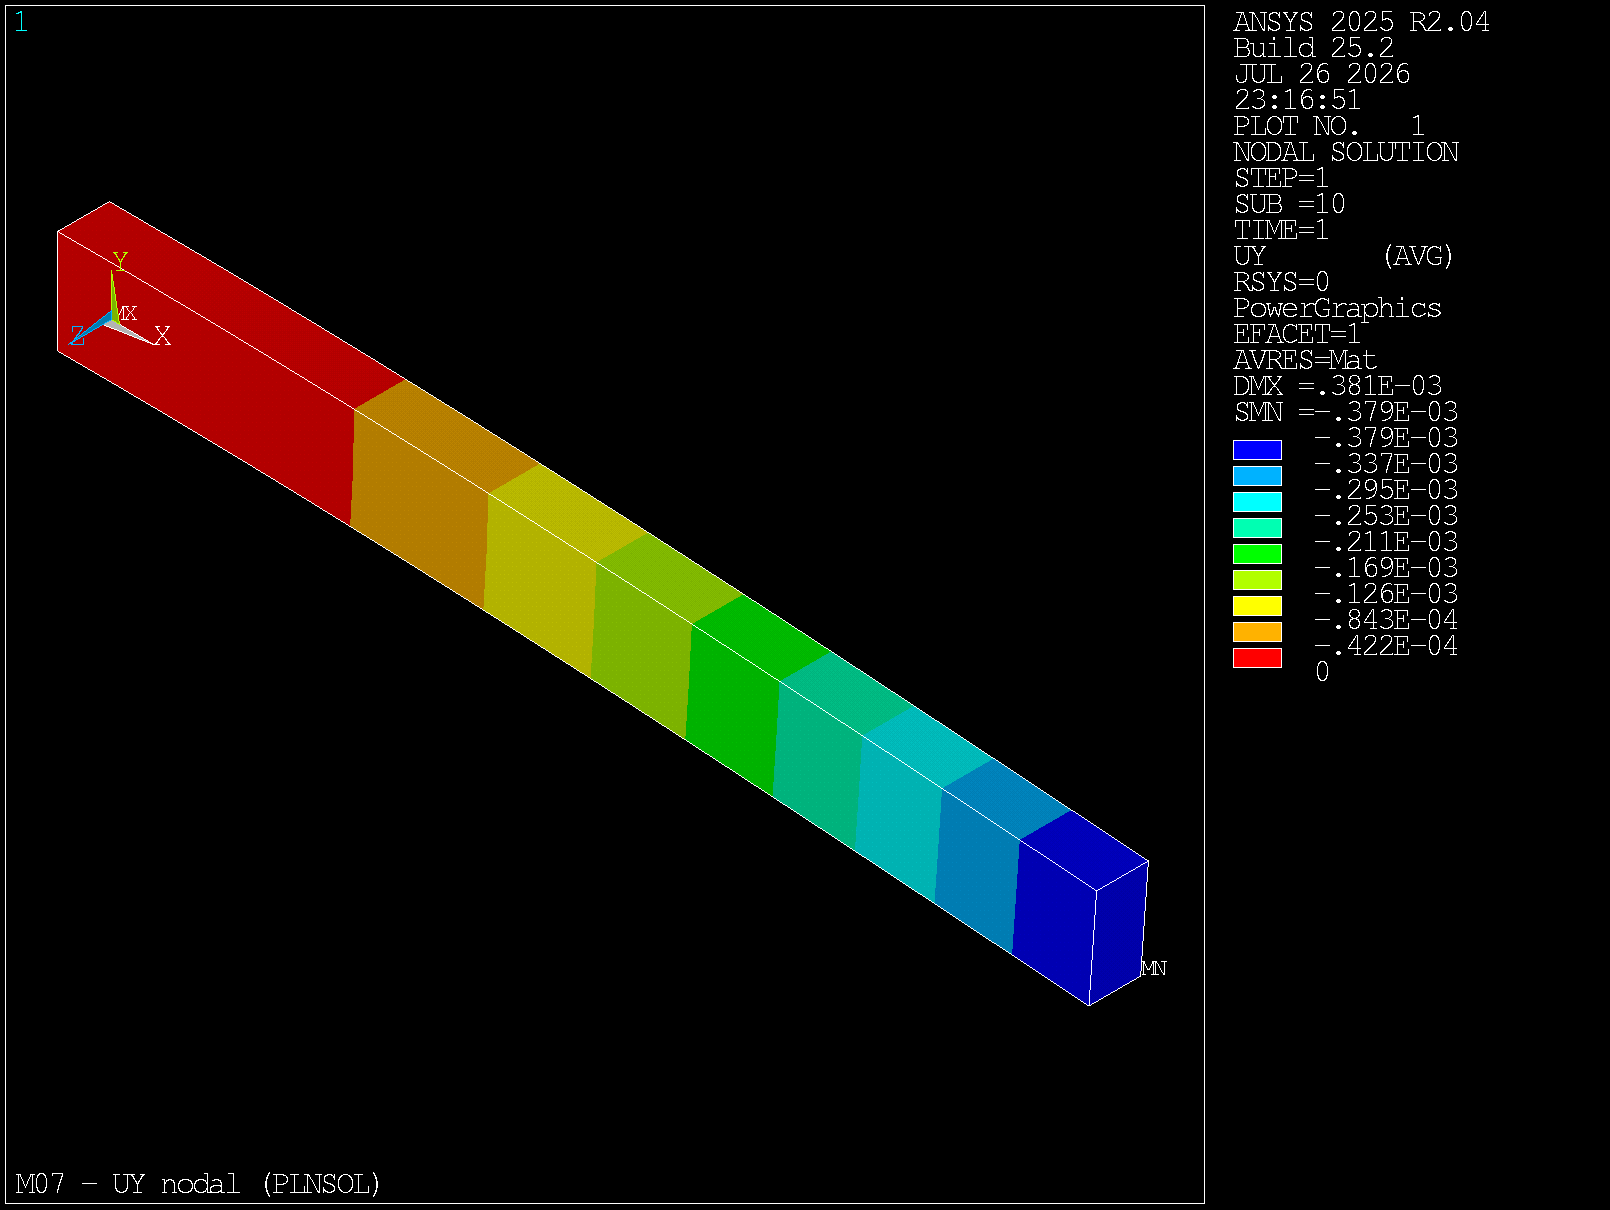
UY (PLNSOL,U,Y).