
Step 3 — Load–displacement curve
/POST1
*DO,i,1,n_sets_geom
  SET,1,1,,,i
  *GET,load_factor,ACTIVE,0,SET,TIME
  *GET,uy_step,NODE,corner_node,U,Y
  ! write row to m10_load_curve.csv
*ENDDO
Calculate geom_dev_ratio = |uy_geom − uy_linear| / |uy_linear|. It must be ≥ 0.05%. Plasticity must produce plastic_dev_ratio ≥ 5% relative to the elastic geometric case.
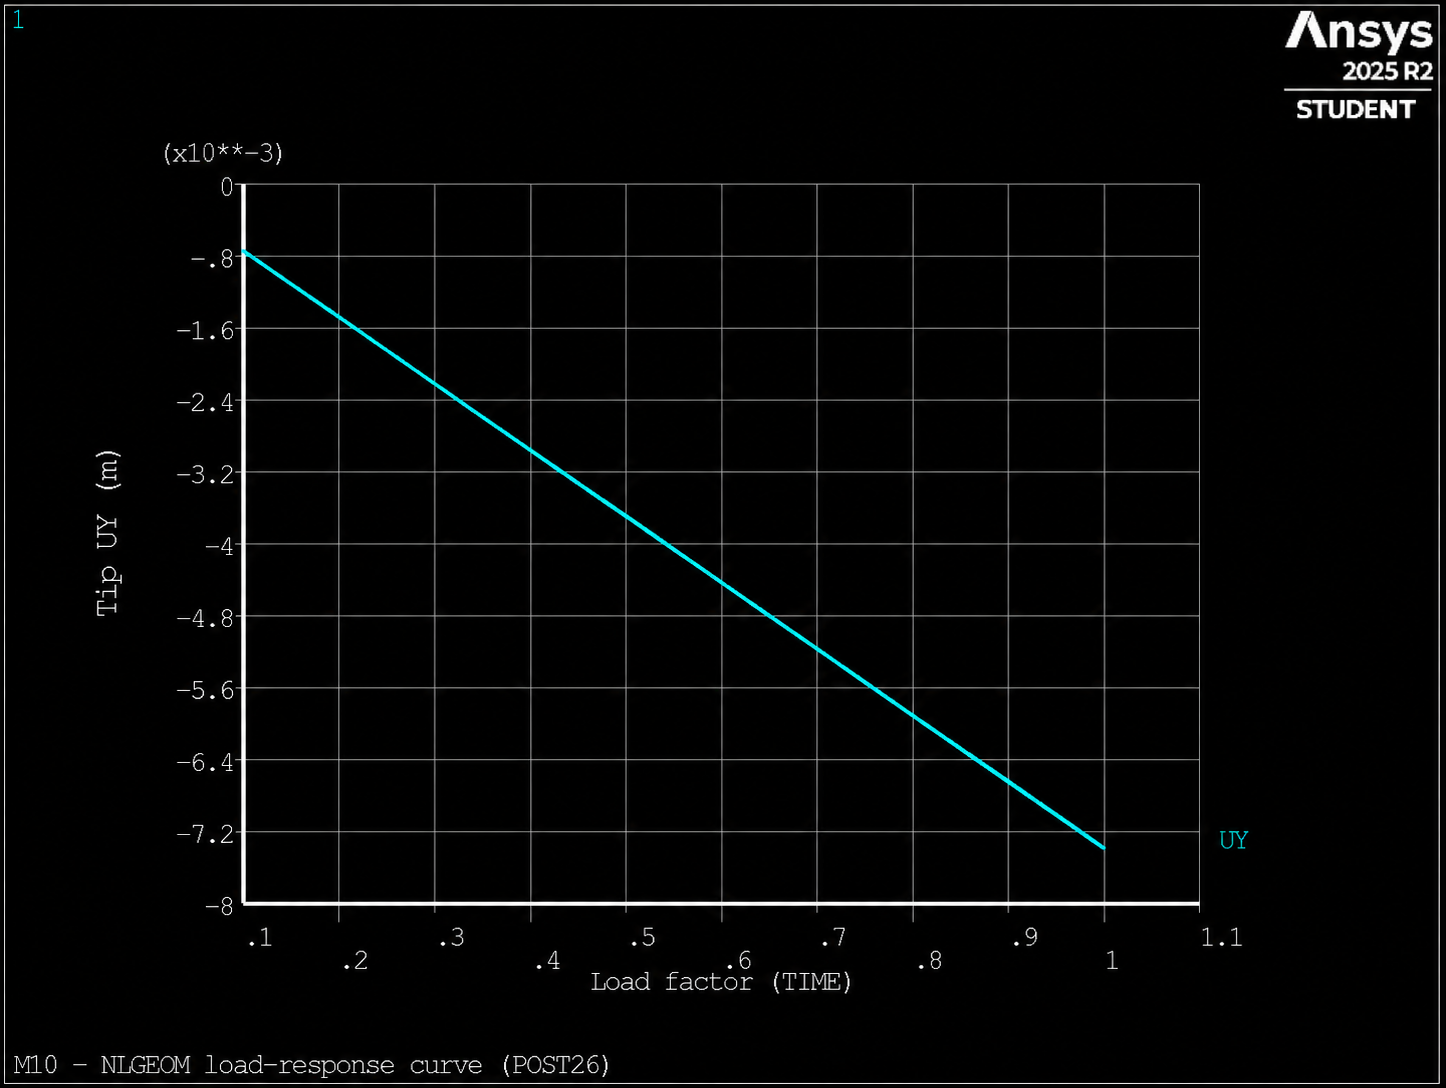
NLGEOM branch (POST26). All three complete branches are in m10_load_curve.csv.